Dr. Lutz Muche, on May 29, 2019, 07:22 AM
The ability to capture real-time production data within a manufacturing environment allows for fast and reliable real-time forecasting and visualization of key metrics related to WIP, cycle time and throughput. Such a real-time information system makes it possible to predict (and subsequently prevent) bottlenecks and starvations, optimize scheduling of equipment maintenance, and visualize WIP as it moves through process steps and equipment.
Imagine a software tool that allows you, the factory operations or logistics management to accurately forecast and detect potential WIP discontinuities (bottlenecks, idle equipment, and impact of scheduled or unscheduled equipment downtime) in real-time, today, with an average accuracy of up to 90% over time. SYSTEMA, working together with our industry partners in a research program, has achieved results that demonstrate exactly these capabilities.
Modern, highly automated semiconductor production is characterized by steadily growing complexity within the production environment. Customer-specific product variants transform the classic mass-production operation (assembly-line production with defined sequence-of-work steps) into sensitive production networks for the simultaneous manufacture of a variety of products. The optimization of such complex production processes is key to remaining competitive.
Real-Time Information System: Forecast Data
Various KPIs are utilized to evaluate effectiveness and productivity, e.g. WIP, cycle time, throughput, etc. Each of these metrics is derived using data from past periods. For modern factory management, in addition to the constant availability of such KPIs in real-time, a fast and reliable forecast of those KPIs in the short-term range has become a necessity.
Typical applications for such forecast calculations include:
- evaluation of the effects of short-term changes (for example, evaluations of changes after an unscheduled breakdown of equipment)
- prediction of dynamic WIP waves over time, either from operation to operation or equipment to equipment
- determination of optimal scheduling of maintenance cycles
- prediction of bottlenecks and idle or waiting periods
Many manufacturers are particularly interested in early detection of bottlenecks in order to be able to counteract them in good time. Such forecasts in real-time during ongoing production show promising results. Here we present some of our findings regarding forecasting WIP levels at consecutive operations in a semiconductor fab.
The work presented here is currently the subject of a research project with the objective to increase forecast accuracy, and finally to produce commercial-ready software solutions for factory control in the near future.
Real-Time Information System: Data Collection
Forecasting data is sourced through a dedicated production database that aggregates large amounts of production process information and is located at the manufacturing site. This production database is currently connected to SYSTEMA’s servers via a standard request/reply message bus service (MOM or Messaging Oriented Middleware) and then integrated into a real-time forecasting information system. In this real-time forecasting system, all data are extracted, transformed and loaded via RODBC (R Open Database Connectivity). An RODBC-based architecture enables the use of R language and routines on the data retrieved from the SYSTEMA Forecast database to calculate forecasts and return results to the SYSTEMA Forecast database. Note that in a production environment, the TEST Environment described below would be located at the Factory site, where the results would be returned and locally stored.
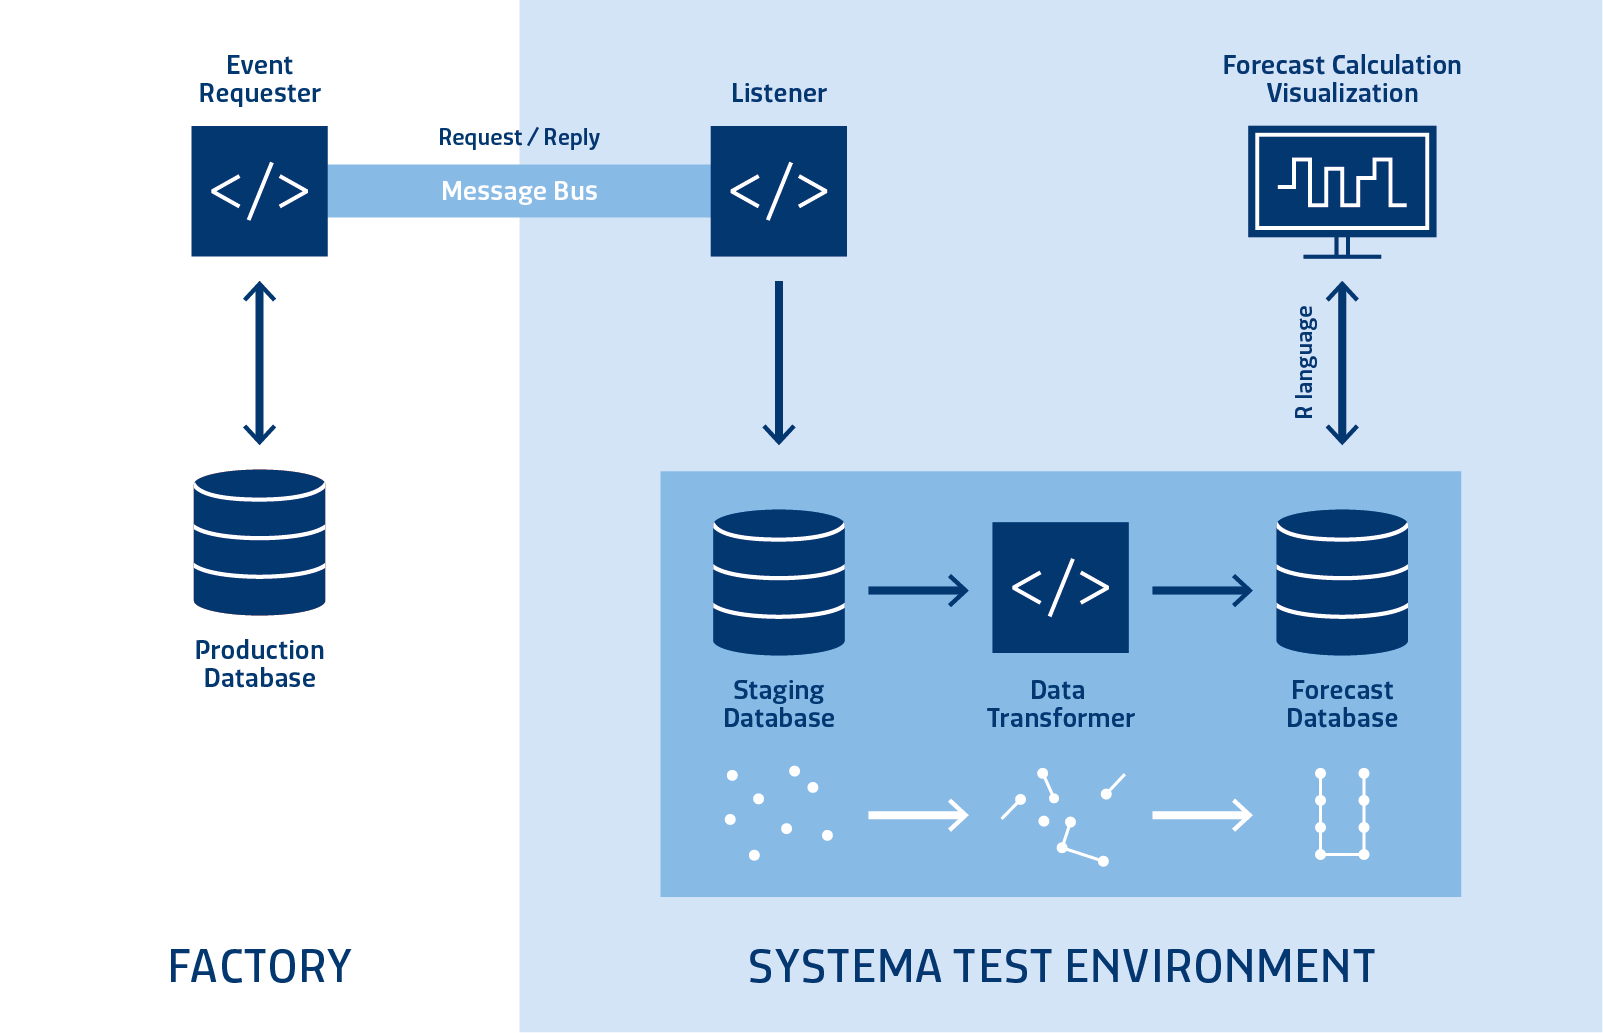
Figure 1 – Real-time forecasting information system architecture in a TEST environment.
Real-Time Information System: Production Forecasting Methods
Using a real-time information system as the basis for comprehensive data analysis, forecast calculations are made and returned to the Factory for visualization.
The open source statistics language R is used in order to implement, vary, test and compare results. R is ideally suited for such research purposes. For use in an active production environment, these R routines will be replaced by more efficient software-coded algorithms.
For the extrapolation of multiple time series of WIP from operation to operation, as shown in Figures 2–5, different mathematical-statistical and neural-net approaches were used, with both well known, standard procedures and proprietary algorithms tested. For all algorithms, the dependency between the individual operations (causal order) was taken into account. The forecast calculations were carried out with hourly mean values for the WIP as well as with the direct times of the transition.
Real-Time Information System: Production Forecast Results
Figures 2–5 present various results using the real-time forecasting information system and the methods described above to predict WIP levels and compare them to the actual data. All data are presented using R plots. The data show that over varying time periods and operations that WIP levels can be accurately forecast eight hours into the future with approximately 85–90% accuracy (mean percent difference between the forecast and reality over time).
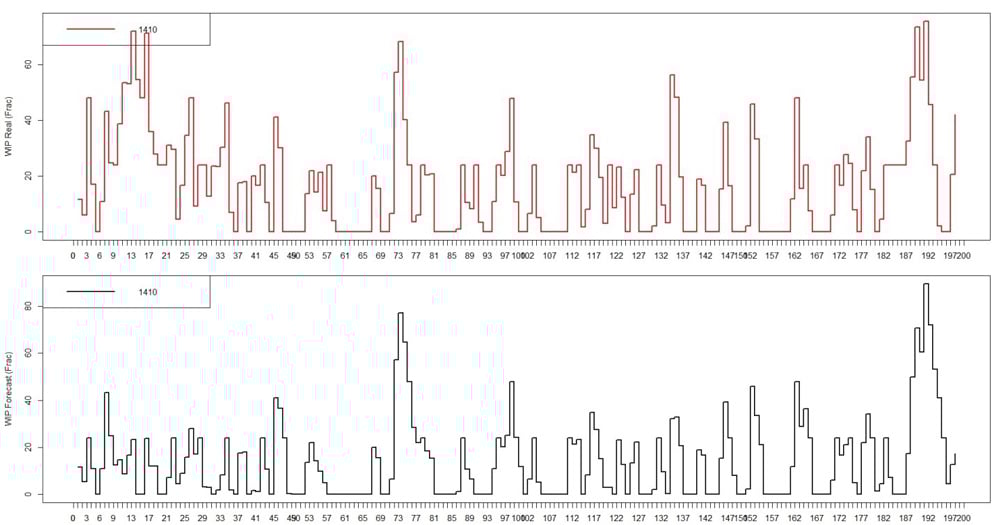
Figure 2 – WIP for one operation over 200 hours (upper diagram: real data; lower diagram: calculated forecast). Mean percentage difference forecast − reality: 9.6% (<10.0% for most of the operation).
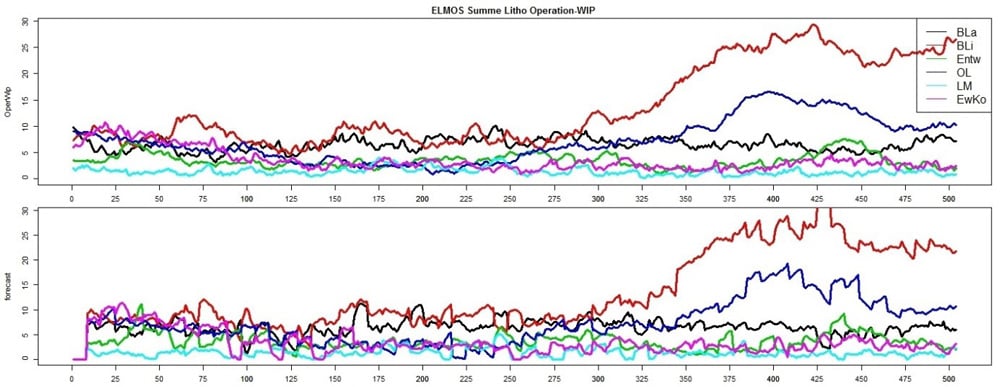
Figure 3 – Hourly average WIP for six consecutive operations over 500 hours (upper diagram: real data; lower diagram: calculated forecast). The forecast is calculated in blocks of eight hours from the last available real data. There is no forecast available for the first block (first eight hours). Legend displays abbreviations for the six lithography operations sampled. Mean percentage difference forecast − reality: 14.1%, 12.7%, 12.6%, 14.3%, 14.5%, 11.7% (BLa, BLi, Entw, OL, LM, EwKo operations respectively).
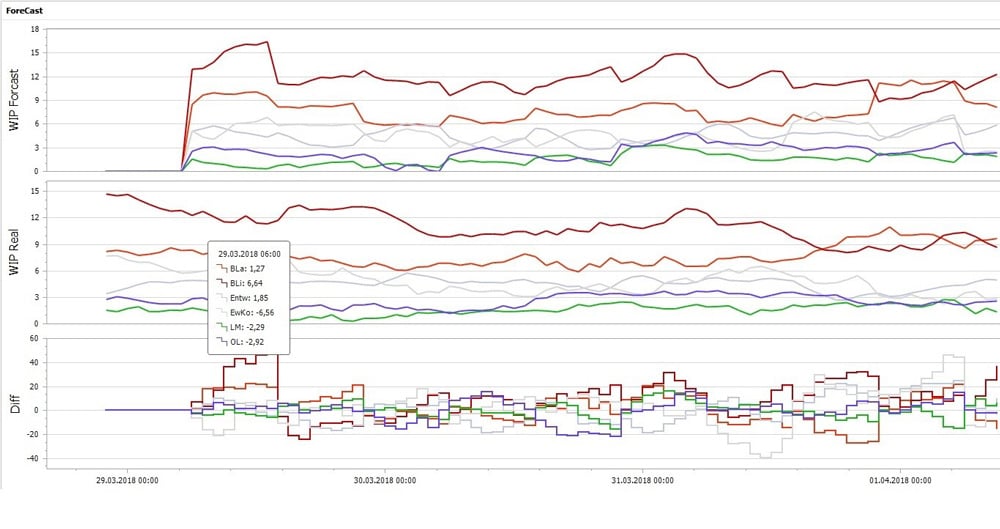 Figure 4 – Hourly average WIP for six consecutive operations over ~100 hours (upper diagram: calculated forecast; middle diagram: real data; lower diagram: percentage difference). The forecast is calculated in blocks of eight hours from the last available real data. There is no forecast available for the first block (first eight hours).
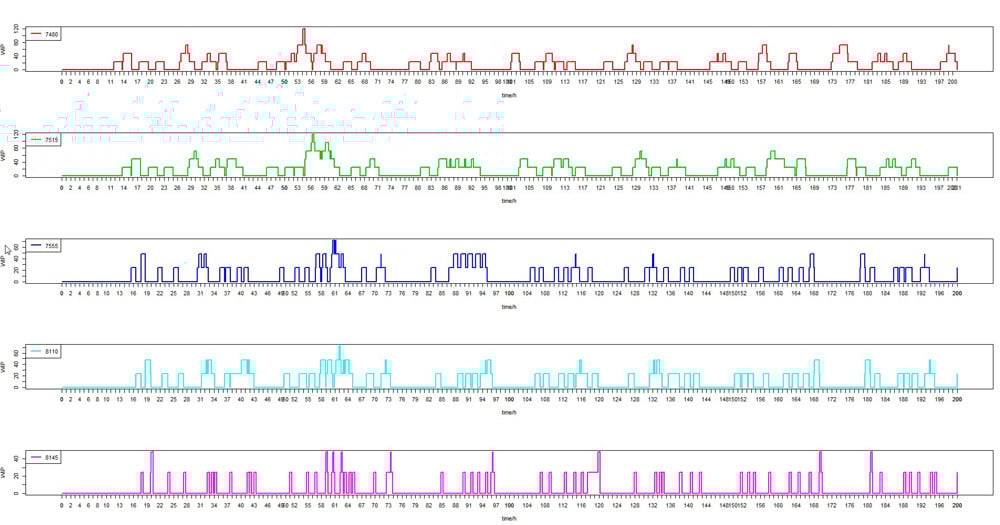
Figure 5 – Direct time course (with step functions) of forecasted WIP for five consecutive operations, starting top to bottom. The interarrival times of the first operation are randomly distributed. WIP waves propagate from one operation to the next. If the processing in one operation is completed, the lot (always 24 wafers) is immediately transferred to the next operation. The processing times vary from operation to operation, but are constant within one operation. Note there are random fluctuations but no bottleneck.
Real-Time Information System: Production Forecast Conclusions
The similarities between forecasted results and actual WIP levels demonstrate that forecasting using real-time production data can provide a useful window into the future. Right now, given the current state of the research, our results demonstrate that WIP levels by operation can be forecast eight hours into the future with an average accuracy of up to 90% over various time periods.
Our research supports the continued development of manufacturing software solutions that provide accurate production forecasting data in real-time. We envision a system where operations and logistics teams can visually monitor forecasted KPIs such as cycle time, throughput and WIP levels from their desk or phone in order to “manage into the future” – proactively adjusting the line to avoid bottlenecks and starvations and manage equipment downtime and maintenance.
More information regarding our approach to big data and deep learning is available on our website. If you want to learn more about our ongoing research and how it may be applied to your manufacturing environment or have other questions, please email us or feel free to drop a comment or question in the comment section below.
Be the first to comment.