Dr. Mike Gißrau, on December 05, 2019, 09:47 AM
This two-part blog series focuses on performance measurement in manufacturing and how to achieve global alignment – across departments and sites. In Part 1, we discussed where the struggles to achieve global alignment originate and how to address them. Here in Part 2, we delve into a general approach to solve common alignment issues in more detail. We discuss typical use cases and identify minor adjustments that can have a major (and positive) impact within your manufacturing environment.
In “Insights on Manufacturing Performance Measurement – Part 1”, I shed some light on how personal decisions, different (or even contradicting) performance indicators, and a lack of communication can (often negatively) impact actual performance in a manufacturing environment. We discussed how important it is to communicate and measure global company strategies and metrics, as well as support individuals to comply with these goals and measures. But how do you set the right metrics for your factory in the first place? And how do you make sure to get value out of your reports?
Four Basic Rules to Define a Clearly Structured Performance Metric
“If you can measure it, you can manage/improve it.” The origin of this statement is not exactly proven, but the bottom line is that measuring your factory’s performance is vital to understanding and improving overall manufacturing effectiveness. And in today’s global environment, company-wide alignment in support of these metrics is vital to your company’s performance in the competitive marketplace.
Ready to begin? Consider the following four guidelines when developing global performance metrics.
Rule 1: Do not define competing performance metrics, even when looking at different departments or across manufacturing levels.
Your factory is a complex organism. Many stakeholders are involved and knowledge is decentralized, with many different experts in many different departments. When you ask 5 different people from a manufacturing plant a question, you get 10 different answers. People from the finance department, for example, obviously tend to focus on money – not necessarily because they think that money is more important than quality, for instance, but because it’s their job to focus on the bottom line. People from the yield or quality department would rather focus on quality over money and would argue that high quality only comes at a certain cost. If you seek to accommodate all these diverse views, not only will you go crazy but your metrics will be inconsistent – or highly complex to say the least – and nobody will be able to use them as guiding measures. Remember, you want your factory’s performance metric to be SMART (specific, measurable, attainable, relevant and time-based).
Rule 2: Define YOUR compromise between time, quality and cost.
You may have heard of the “Project Management Triangle” (also called Project Triangle or Triple Constraint). The Project Management Triangle demonstrates that when managing a project (or a factory) the three main criteria that need to be balanced are time, money (cost) and quality. Most performance metrics are related to one or another of those three. The main idea is that time, money and quality are interrelated and focusing on one point, influences the others.
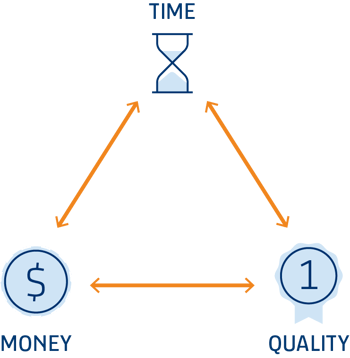
Figure 1: The Project Management Triangle – where do you compromise?
Below are a few simple examples of competing performance indicators common to the semiconductor industry (and other discrete manufacturing) that are often interconnected:
Common Competing Performance Indicators in Semiconductor Manufacturing
Time:
- On-time delivery
- Cycle time
- Throughput
Money:
- Production cost per unit
- Material per production step (or cost per production step)
Quality:
- Yield
- Losses per production step
- Scrap rate
These performance metrics can be combined into more complex metrics like Overall Equipment Efficiency:

Figure 2: Formula for OEE calculation.
Every factory is different. We often see that even among different sites in one company, the calculations for the various parts of a performance metric like OEE can vary, as each site tries to locally optimize their own priorities and/or the metrics they report up the chain.
I said above that you shouldn’t try to please everybody, but do talk to your people and understand their environments and focal points. You might discover conflicting goals, such as operating staff being measured on “moves per shift” (which leads to optimizing general throughput) while your overall company strategy is to satisfy the customer with on-time delivery. It might even be the case that if your operators choose to prioritize some lots over others they might actually get in trouble – or even violate their contracts! If that’s the case, you’ll have a hard time improving on-time delivery.
You need to define and choose measures that are most effective for what you want to achieve, considering your production environment, your market and competition. But be careful to choose only the most important – and, yes, only a few – metrics that you want to measure and use for optimization. In the end, more performance metrics do not equate with better performance of your facility.
Rule 3: Use the same metrics company-wide.
Once you’ve selected a limited number of performance metrics and validated how they’re being calculated, it is imperative to use those same, standardized metrics across the company. Everyone should be able to articulate the company’s most important goals in order to ensure that from operator to plant manager everyone is making choices and decisions that optimize the same goals and metrics. There is simply no other meaningful way to steer the ship in the right direction.
Rule 4: As the saying goes, “Never trust any statistics that you didn’t forge yourself.”1
As we said in the beginning, you want to measure performance in order to identify how to optimize your production. You know that there is room for improvement, but you don’t know exactly where to start. You need to see the plain and ugly truth so that you can start to do something about it.
However, planning and operations staff in charge of gathering the data sometimes prefer to gloss over issues by developing “nice” statistics. A lot of effort can be expended toward “enhancing” statistics instead of focusing on root cause of problems. In the end, your staff are measured on the metrics that have been defined, right? In manufacturing environments, we often see performance statistics that are being “cleaned” to avoid long conversations (or problems) with management. This practice, however well intended, makes performance evaluation quite difficult.
We have come across two typical ways that performance metrics are “cleaned”. One way is to remove “unwanted elements” from overall statistical performance evaluation (e.g. from the cycle-time statistics or the on-time delivery evaluation provided to upper management.) These “unwanted elements” that are systematically eliminated from performance metrics might be product prototypes that run through production slower than more sophisticated products, or, in high-volume production environments, small-production elements or technologies.
Another way to generate “nice” statistics in reports is to adjust the scale units to make results stand out more to the human eye, when in reality, the measured differences among the data are negligible.
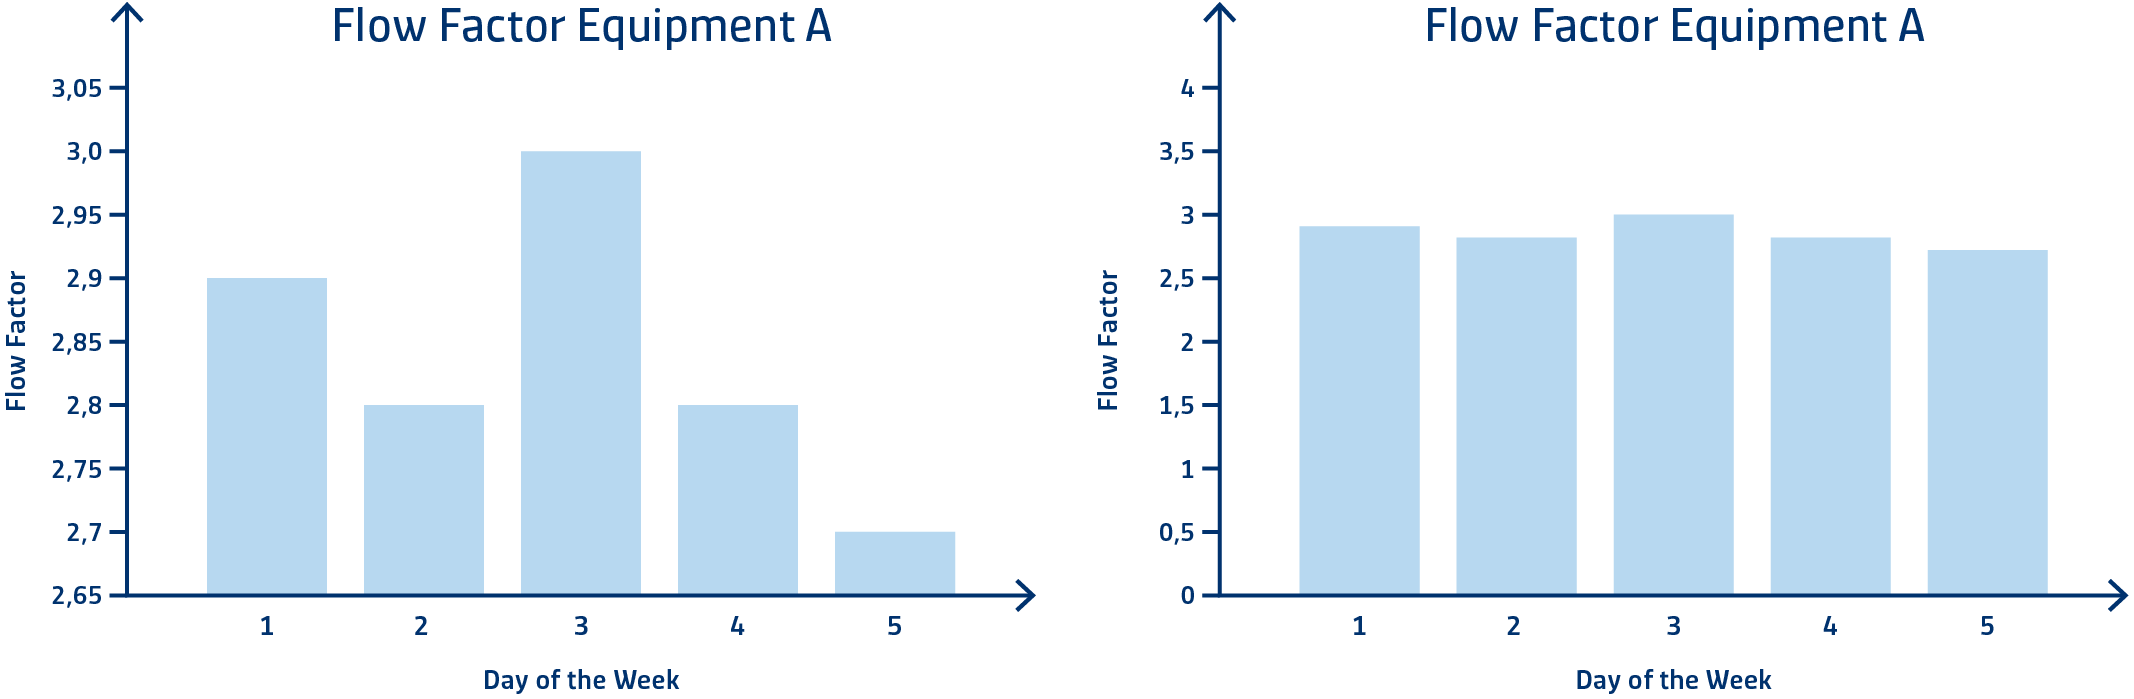
Figure 3: The same statistic displayed on two different y-axes.
On the left chart in Figure 3, Equipment A’s flow factor appears to have improved dramatically by day five. However, viewing the chart on the right side of Figure 3, you may reach a different conclusion, even though the data are the same.
To actually improve manufacturing processes, it is imperative to take a detailed look at the “real” data; that is, data that haven’t gone through any “cleaning” or statistical preprocessing. Only these data provide a clear picture of what really happens in the factory, allowing you to identify issues or gaps, understand what it would take to improve, prioritize the work and start the optimization process.
Conclusion
Using performance measurement metrics can be a true enabler to start your company-wide, production optimization journey. If you consider these four basic rules I’ve outlined above as your foundational principles upon which to build, you can begin to see root causes, trends and opportunities from a holistic point of view. Let the optimization journey begin!
1 This is another common saying whose origin is unclear.
Be the first to comment.