Dr. Holger Brandl, on October 13, 2020, 02:06 PM
Do you know how often shopfloor tools autonomously report their status? Do you know if your material tracking can flag lots that are likely to become overdue? Do you know which IT & operations infrastructure components send heartbeat events to reflect their health status regularly? Surely you do. But do you also know how long it takes an incident, such as an anomaly, a forgotten lot, or an unexpected tool down, to be noticed by operations and equipment engineers? In many factories incidents slip through unnoticed initially, and are revealed only much later by analysts. In this article, we will explain and demonstrate how the delay between incident and action can be reduced to the lowest possible minimum using stream analytics.
Introduction
Traditionally, analytical solutions that use data to optimize material flow and tool usage in manufacturing are built either on top of data warehouses or – more recently – using data lake solutions such as Hadoop or Spark. Initially, data from multiple sources such as MES, FDC, IoT, EI or ERP are ingested. Later, analysts build analytical models at various levels of time granularity such as shift, day, week or quarter. While this approach does typically provide insights into issues with shopfloor equipment, MES or material routing, it typically introduces a delay between time of incident and discovery of hours and sometimes even days or weeks. This delay between incident and action often dramatically reduces the benefits of such solutions.
Until recently three limiting factors prevented analysts and data engineers from providing more timely insights to the shopfloor.
- First, most BI solutions are centered around SQL, which does not provide the required technical tooling to model and integrate time series data in real-time. By analyzing the data in batches using scheduled jobs instead of in real time, insights gained from analysis cannot be applied quickly enough to maximize their full potential benefits toward streamlining production.
- Second, the sheer volume and scale of shopfloor data that need to be gathered, cleansed, integrated and modeled cannot be processed with data warehouse and database systems in real time. Thus, analytics have often been designed to be executed at a later time when computing resources become available.
- Finally, although the notion of event streaming is rather well established, many concepts such as consumer-delivery semantics or event-stream joins were developed and implemented only very recently. Without these concepts, data engineers lacked the necessary framework to model time series data adequately to provide real-time insights at the earliest time possible.
What is Event Stream Data Analytics?
Event stream processing (ESP) deals with the task of processing unbounded series of records by means of aggregation, correlation, enrichment and machine learning. The goal is to identify patterns, trends, relationships and anomalies within these streams. It usually takes some time to wrap one's head around this idea, which can be applied almost universally whenever entities emit information continuously at some rate.
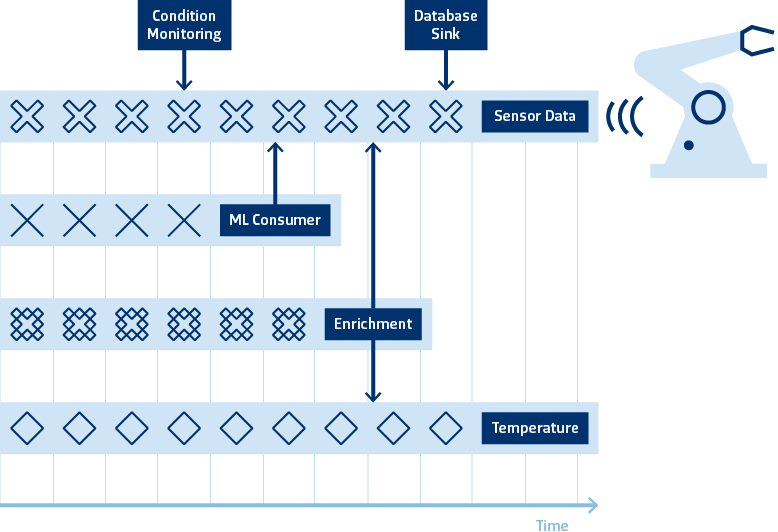
As an example, let us envision a legacy tool that is instrumented with a retrofit IoT solution to provide real-time insights into its state. The raw events are appended to a persistent queue that is consumed by various stream consumers. These consumers may be a database sink for BI inspection, a condition monitoring module or a machine learning model that discretizes a sensor-events stream into a sparser state-change event stream. Very often, individual event streams need to be interleaved – or joined – to enrich the event data. In the above example, shopfloor temperature data is used to provide more context to equipment logs. The result of this enrichment is another stream of events that is also an essentially infinite – unbounded – data set because of its ever-growing nature.
Building an ESP Solution
Building event streaming solutions comes with many challenges, such as different event rates, varying timeliness of the events, consumption rate limitations, and so on. Lucky for us, a firm methodology has emerged across vendor solutions that boils down to just 4 central questions.
- What results are being calculated?
- Where in event time?
- When in processing time?
- How do refinements of results relate?
In particular, when using this methodology, the difference between event time and processing time is key to correctly reasoning about time in unbounded data sets.
A reduced form of event stream processing has been broadly adopted for many years across various manufacturing industries by using message oriented middleware (MOM) for interprocess communication. However, factory message brokers, which are widely used to cope with the scale and real-time requirements of interprocess communication in modern manufacturing sites, often lack a stateful persistence model. That is, these systems often do not store events for later analysis. Adding persistence in a robust and scalable way is a complex and technically challenging task that has been implemented only in recent years in stateful event brokers such as Apache Flink, Google Cloud DataFlow or Apache Kafka. We particularly love Kafka because it is used and trusted by 80% of Fortune 100 companies, is increasingly adopted in manufacturing and allows for on-premise as well as cloud deployments.
An ESP Example: Heartbeat Monitoring for IT Operations
Manufacturing automation solutions provided by SYSTEMA rely on a solid operations model to introspect state of software deployments. Often we build on top of TIB/RV, which is the quasi-standard MOM communication backbone for many companies with mission-critical real time applications, especially in event-driven semiconductor fabs. It is also used in many other industries such as finance, media and transportation.
Thus, there is a strong interest in keeping the MOM backbone up and running. The TIB/RV software consists of communication agent processes, so-called daemons. These daemons publish information about their health to the network they are "living in" on a regular basis.
It is very useful to pick up these so called daemon heartbeats to monitor daemon state and detect critical situations before they arise. The daemon heartbeat monitor described here, does exactly this. It not only looks at the last event state but keeps a history to detect trends and make extrapolations and predictions. If a critical state is detected, a warning is triggered. This warning can be consumed for instance by sending an email or with programmatic endpoints.
On each heartbeat the daemon provides a set of parameters. Some of them are metainformation including the daemon location, group and categorization. Other fields are numerical KPIs such as client count, messages sent since startup, l sent, bytes sent, messages received, packets received, and bytes received, as well as also retransmitted packets and lost packets (in and out).
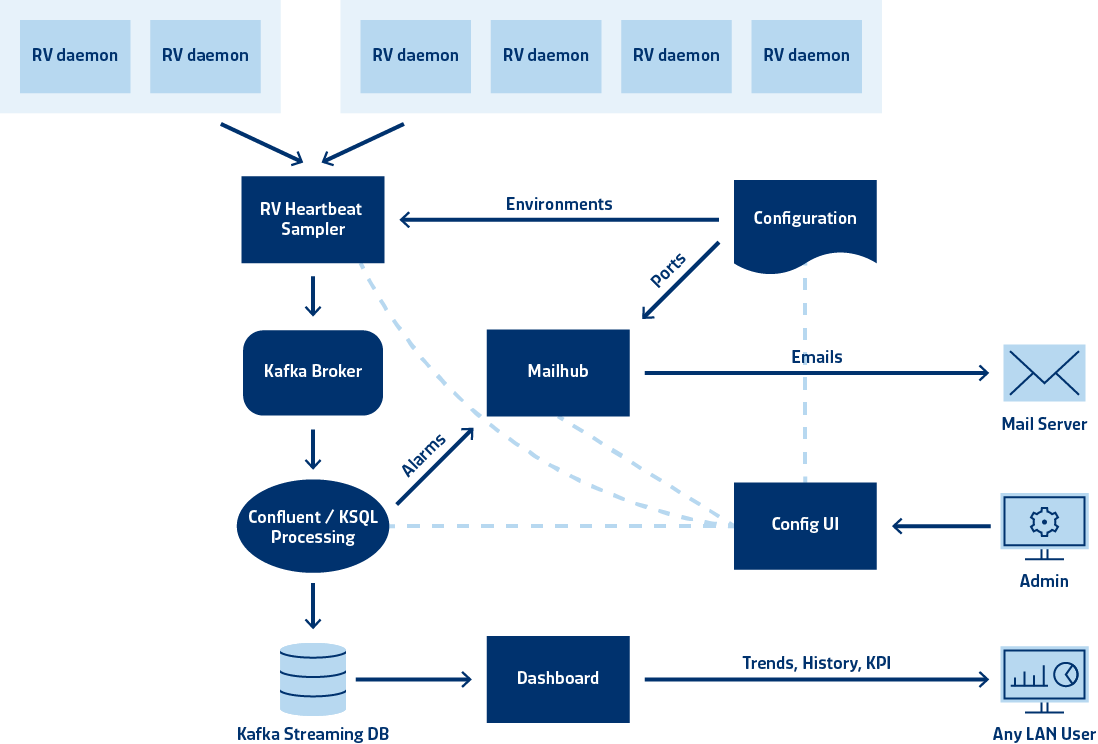
System architecture of the daemon heartbeat monitoring application.
Using KSQLDB, a scalable real-time event streaming database built on Apache Kafka, we implemented an analytical stream processing application to model a wide range of operational irregularities along with suitable actions to resolve them. Here we highlight four operational conditions that the application monitors and acts upon: no heartbeat, data loss, excessive client count and retransmission rate.
No Heartbeat
If the heartbeat of a daemon that should be in the system is missing, then the software assumes the process has died. This is the most serious situation, since all the applications connected to this daemon lose connectivity. Normally, daemons do not die on their own, but sometimes they are killed accidentally and do not autostart as expected. We have also seen cases, where the host rebooted after a power outage and the daemon process is bound to localhost, losing functionality.
Data Loss
A daemon reported data loss. Some of its clients did not get the data they expected or could not send. This is a serious problem. Loss of data, that should have been transferred but was not is the most critical error in the daemon-daemon communication protocol TRDP. Data loss happens seldomly, but we want to avoid it as much as possible. You can often anticipate it by analyzing related retransmission rate KPIs.
Excessive Client Count
The number of clients (CC) of a daemon is limited. The limit depends on resource limitations (memory, CPU, network resources, ...) but, more often, the operating system sets clear quotas for the number of connections for a process. Before a horizontal scaling (distribute more daemons) or vertical scaling (increase capabilities of daemon) is implemented, expect a period of time with errors.
Excessive client counts can be avoided by detecting when the count limit is approaching. The heartbeat monitor sends a warning email out, if the CC reaches 80% of the maximum allowed value. This usually leaves enough time to take counter measures such as adding more daemons or load balancing.
Retransmission Rate
Under load in production, daemons sometimes miss UDP packets. Usually the MOM internally compensates for such problems within a reliability interval (RI). The rate of retransmissions compared to the rate of payload data in a time interval is a metric of how good the communication is. Retransmissions are usually preceded by data loss, which is the most severe problem to avoided at all cost.
The heartbeat monitor will send an email, if the retransmission rate inbound or outbound is exceeded. This is a problem between daemons, so typically more than one daemon will issue the message.
Advantages of Event Stream Analytics Using Apache Kafka
We have built many custom ESP solutions. Still, it became clear to us that by designing them with ESP semantics in mind, using a solid technical platform such as KSQLDB and Kafka, a cleaner, more scalable and less error-prone design is achievable. The Apache Kafke platform provides many interesting capabilities without additional engineering efforts, such as:
- Replay of production incidents histories
- Introspection and monitoring of stream processors, e.g. to provide SLA concerning consumer lag
- Lower latency while ensuring more strict time-series semantics
- Baked in data management to support customer-defined lifecycle policies
- Integrated model to real-time and historical data analysis
Testability is always a concern when building event processing applications.In this regard, Apache Kafka exceeded our expectations. Using well-defined, simulated test scenarios, the strong processing order guarantees and ESP model provided by the platform, ensured 100% test coverage in complex scenarios, meeting latency and capacity SLAs.
Challenges When Building an ESP Solution
It took a small team of event streaming engineers approximately 2 months to develop the solution. Modeling the different anomaly scenarios turned out to be the key part here, and it was facilitated by the advanced functionality provided by Kafka and KSQLDB. In particular, the rich ecosystem that allowed us to bind various endpoints, such as databases, alert services and reporting tools, enabled a clean and consistent application structure and architecture.
As our ESP solution is built on a fast-evolving technology stack, we had to cope with partially asynchronous release states within the Kafka platform. Also, the SQL-like interface for event streams provided by KSQLDB initially lacked some features. However, due to the extensibility and open-source nature of the stack, our engineers could plug in missing bits and pieces.
Often stream processing is associated with high rollout efforts. We decided to deploy the various components, including Kafka, KSQLDB, monitoring dashboards, configuration UIs, alert services and so on, using docker-compose to benefit from a well-defined deployment definition and release plan. Nevertheless, it took us some time to properly evolve the interprocess dependencies and relations into a testable system that could be easily deployed on orchestration engines such as Kubernetes to allow for arbitrary scaling and high availability.
Summary
Event stream processing provides more timely insights into shopfloor data. Using a modern processing paradigm to aggregate, combine, compare and model events in real-time, it dramatically reduces the delay between incident and action. For instance, ESP enables the detection of irregularities in IT systems in real time, helps to spot and reroute stalled material, puts a spotlight on unused capacity while machines are still idle, and can point out equipment deficiencies before a tool breaks.
SYSTEMA is providing event processing solutions for manufacturing on platforms such as TIBCO/RV, IBM Streams, RabbitMQ, MQTT, ActiveMQ and Kafka. With our strong expertise in implementing and operationalizing ESP solutions, we are happy to assist and support your journey towards more seamless operations, increased throughput or better delivery-date adherence.
Be the first to comment.